


Goodville provides a number of techniques for assessing players' psychological aspects, levels of emotional well-being and cognitive skills. Data on psychological aspects of players is being collected remotely. Players provide answers to the questionnaires, then the data is processed and interpreted and the results are scientifically analysed. The development of evidence-based conclusions requires reliable and valid data. However, the remote nature of respondents' answers and the game context of implementing a psychological survey create a high chance of obtaining non-valid results. Players may respond carelessly to items on questionnaires, making random or attitudinal clicks, leading to responses that falsely describe players' psychological characteristics. At the same time, there is a probability that a certain number of players will give valid answers that accurately describe their mental state. Based on this answers that scientifically valid we draw conclusions. Mixing valid and invalid data distorts the results and sometimes leads to inaccurate conclusions. Therefore, one of the tasks of scientific data analysis is to determine which answers are valid and which are not. Once invalid answers are identified, they are removed from further processing. Subsequent analysis is done only on the basis of valid data.
The aim of the present study was to scientifically substantiate the techniques for assessing the validity of players' responses to items of questionnaires integrated into the Goodville game, and to select valid responses.
The hypothesis of the study is that the data collected through the psychological assessment techniques of Goodville application contain both valid and invalid player responses, which can be differentiated using modern psychometric methods.
Modern psychometric techniques based on IRT analysis, in particular the Rasch model, were used to assess the validity of players' responses to the Goodville application questionnaires. The Rasch model is a psychometric method for assessing respondents' answers to questionnaire items. The aim is to determine whether respondents' item responses can be interpreted within a real psychometric scale based on a total score. To achieve this goal, the Rasch model uses a sophisticated mathematical tool to model the measurement scale from the raw data - the respondents' answers. The scale is designed to best characterize the raw data. The implementation of Rush modelling is based on finding the two parameters necessary for constructing a psychological measure: the difficulty index of each diagnostic item and the level of the respondent's measured psychological construct. Item difficulty is functionally related to the probability of providing a diagnostically significant (or key) response to that item. The higher the difficulty is, the lower the probability of giving a key response. The level of a construct quantifies the respondent's expression of the measured construct. The higher the respondent's level of measurable construct, the higher the probability of providing diagnostically meaningful answers to the difficult items on the questionnaire. The mathematical tool of the Rasch model includes a system of differential equations based on the basic Rasch equation. This equation postulates that the chance of a key response to an item is a function of the difference in construct level and item difficulty.The higher the level of the construct and the lower the item difficulty, the higher the chance (probability) of obtaining a diagnostically meaningful response to the item.
At the beginning of the psychometric analysis, only the respondents' actual (observed) responses to the questionnaire items are known. The task is to use the research apparatus of the Rasch model to find the most plausible estimates of the respondents' levels of the psychological construct under study and the difficulty of the diagnostic items on the questionnaire using the raw observable data. Special mathematical procedures are used to accomplish this task: the maximum likelihood method and the Newton-Raphson procedure. The obtained estimates of the measured construct and item difficulty are calculated using the basic Rasch equation and presented in the form of logits - the logarithms of the chance of a key response. As a result of the calculations, a measuring scale is modelled on which all levels of the measured construct and measures of difficulty of all items in the questionnaire are represented. For the topic of this article, we are interested in how the validity of respondents' answers to the items is assessed. After finding the unknown values of the construct and item difficulty measures, the expected chances (probabilities) of the key responses that respondents with the calculated levels of the construct could provide to the items with the calculated difficulty measures are modelled using the Rasch equation. The found values of the construct and item difficulty measures are fitted into the basic Rasch model equation and the chances of key responses are calculated. The modelled key answers are then compared with the observed key answers, which are the original answers of the respondents. The comparison is made by calculating the rms differences (residuals) between observed and expected key responses.RMS residuals are calculated for each questionnaire item and for each respondent. Their distribution corresponds to the xy-squared distribution. Otherwise, RMS residuals are called item quality indices and respondent quality indices. To assess the validity of the players' responses to the items in the questionnaire, respondent quality indices are of interest. Each player who responds to the items in the questionnaire has a quality index value calculated using the Rasch model. The ideal index values correspond to 1. In this case, the modelled and actual item responses are consistent with each other. In practice, however, ideal values are uncommon. More often there are deviations from the ideal value in one direction or another. Rather, one should not speak of an ideal value, but rather of a range of acceptable deviations from 1. The literature suggests different ranges of acceptable quality index values: 0.8-1.2, 0.7-1.3, 0.6-1.4, 0.5-1.5. A narrower range of deviations corresponds to more stringent requirements for the accuracy and validity of respondents' answers. When choosing the range, the characteristics of the questionnaire and the way the items are answered are important. If the value of the quality index exceeds the upper limit of the range, then the answers of the respondent do not assess the expression of their measured psychological construct, are of a random or sloppy nature. Such answers can be regarded as "noise", they reduce the validity of the results of the whole sample. In these cases, the total scale score obtained by the respondent does not correspond to the actual level of the construct being assessed. If the sample contains a significant number of respondents with abnormally high values of the quality indices, the conclusions from the study will be false. If the values of the quality indices are less than the lower limit of the range of acceptability, it means that the respondent's answers are overly predictable. The problem with predictable answers is that they are attitudinal, too unambiguous. The response to each individual item is not individual, and responses to items of the same focus may overlap. As a result, the accuracy of the construct is reduced. The validity of the results may also decrease, because meaningless items with predictable answers may shift the focus of validity of the whole questionnaire.In some cases, responses from respondents with moderately reduced quality index values on meaningful diagnostic items centre the scale, thereby increasing its validity.
The validity of the players' responses to the Goodville questionnaires was determined by estimating the values of the player response quality indices and by a visual analysis of the player response pattern. A player's response pattern is a sequence of his scores obtained in answering the questionnaire items. For example, if a player gets 1 point for item #1, 4points for item #2, 0 points for item #3, and 3 points for item #4, then his response pattern is 1-4-0-3.
Let's consider the process of selecting valid player responses using the Emotional Equaliser technique as an example. TheEmotional EQ is a list of 7 positive and 9 negative emotions. The player is asked to rate the expression of each emotion at the moment on a seven-point scale. A score of 1 corresponds to not experiencing the emotion and 7 - to its maximum expression. A fragment of the questionnaire interface is shown in Figure 1.
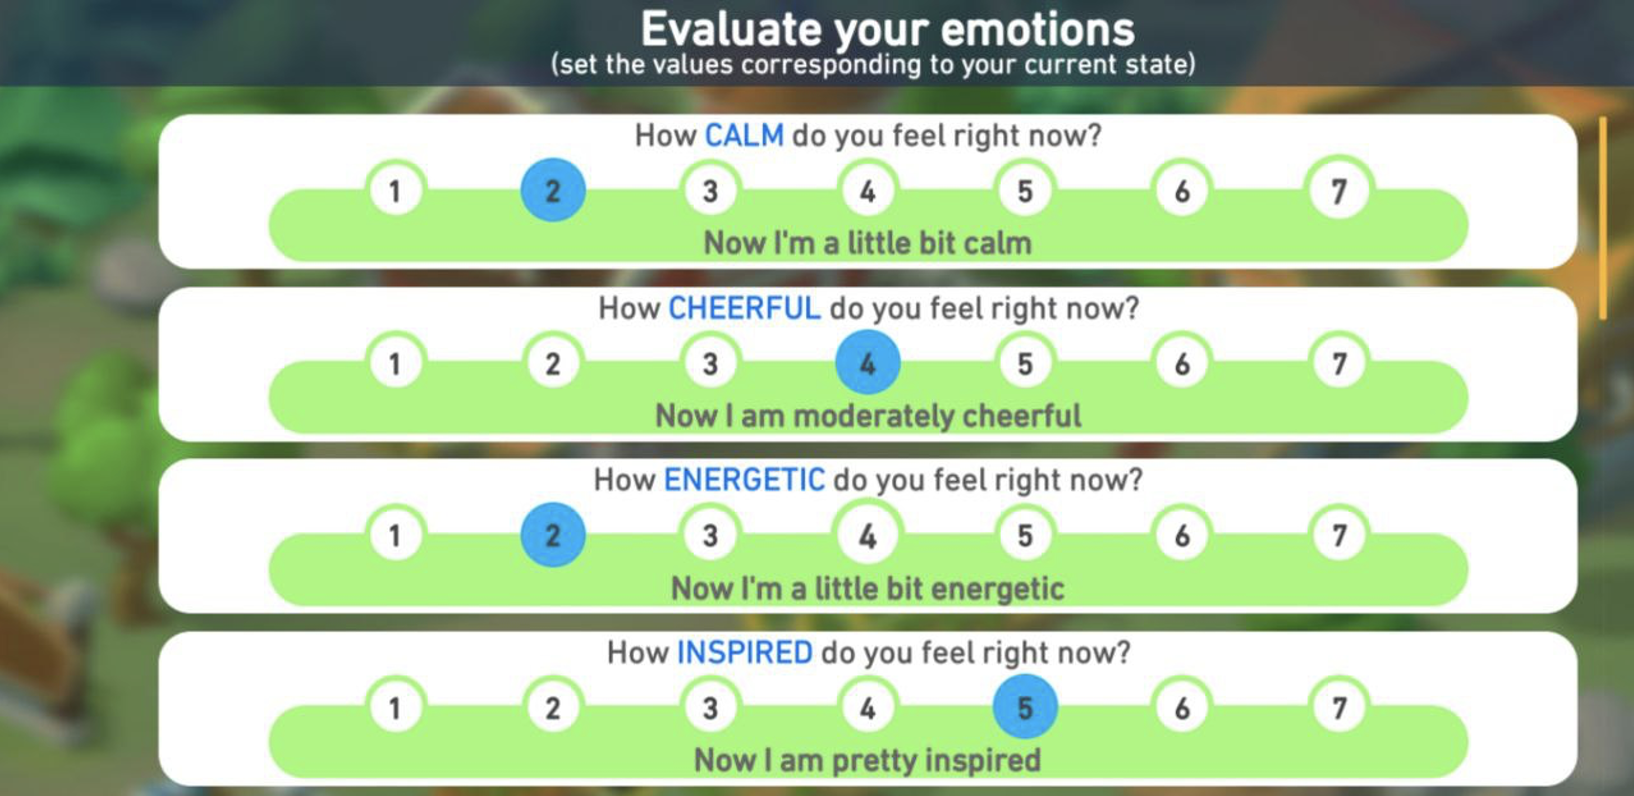
Emotional EQ includes two scales: a scale of positive emotions and a scale of negative emotions. The scale of positive emotions consists of the following items: "calm", "cheerful", "energetic","inspired", "happy", "joyful","strong". The scale of negative emotions includes items such as 'overworked', 'despondent', 'guilty', 'jaded', 'unfriendly', 'insecure','irritable', 'lonely' and 'overwhelmed'. The response scores are summed foreach subscale.
A sample of2713781 response patterns was obtained to scientifically analyse the results of the players' emotional state assessment. This sample was subjected to primary filtering with technically poor responses removed. 295120 (11%) sequences with missing responses were removed.Then 566112 (21%) patterns with the same responses (patterns with zero variance) were removed. From the remaining sample, 784454 (29%) repetitive response patterns (duplicates) were removed. The remaining sample of 1068095(39%) patterns was subjected to psychometric IRT analysis based on the Rasch model with the calculation of player response quality index values. Quality index values were then assessed in conjunction with a visual assessment of response patterns. As a range of acceptable response quality index values, the maximum acceptable range of0.5-1.5 was chosen. In the result of the analysis 321710 (12%) response patterns were identified with low values of quality indices (less than 0.5). Figure2 shows examples of response patterns from this group.
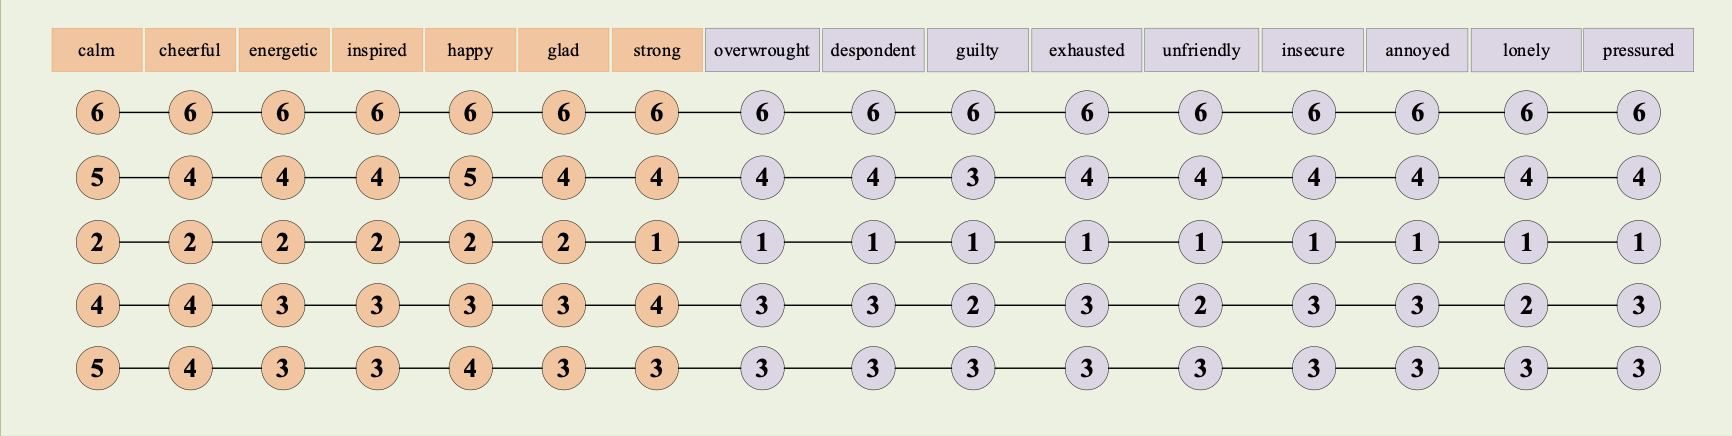
Visual assessment of the answers presented in Figure 1 shows that these patterns have extremely low variance, the answers are often repeated and the scores do not differ from each other by more than 2 points. These answers are predictable, set in place with a set sequence. The player's response to each individual item is not likely to reflect the expression of the emotion assessed by that item. Such player response patterns were removed from further analysis as poor-quality answers.
In addition, 202794 patterns with excessively high values of the quality indices were found. Examples of such response patterns are shown in Figure 3.
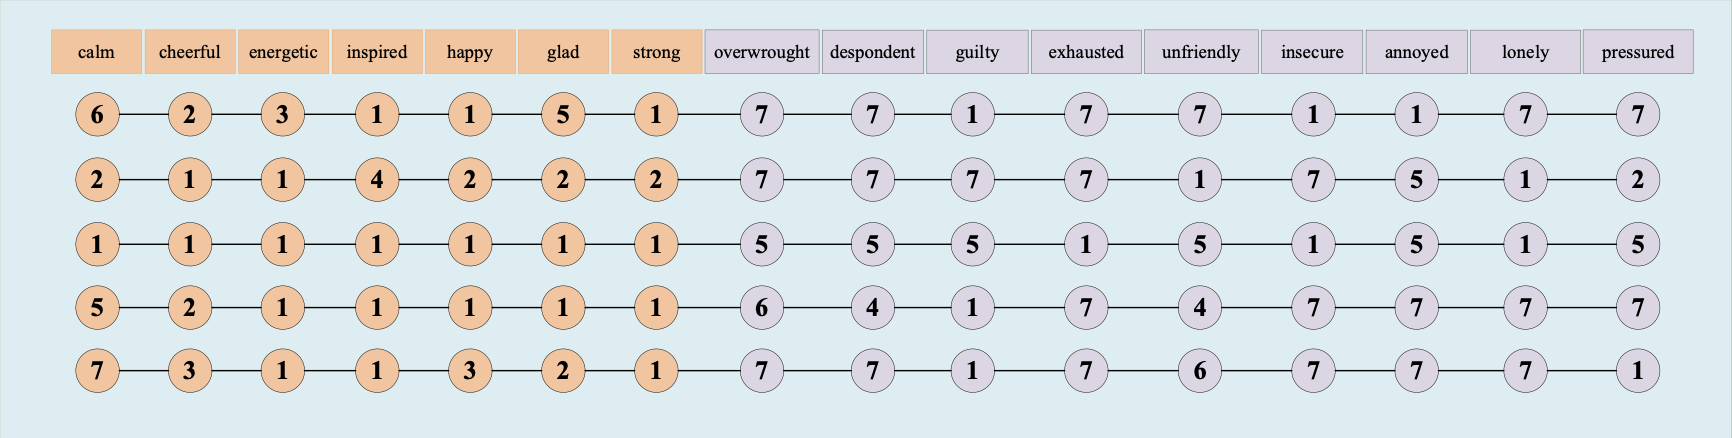
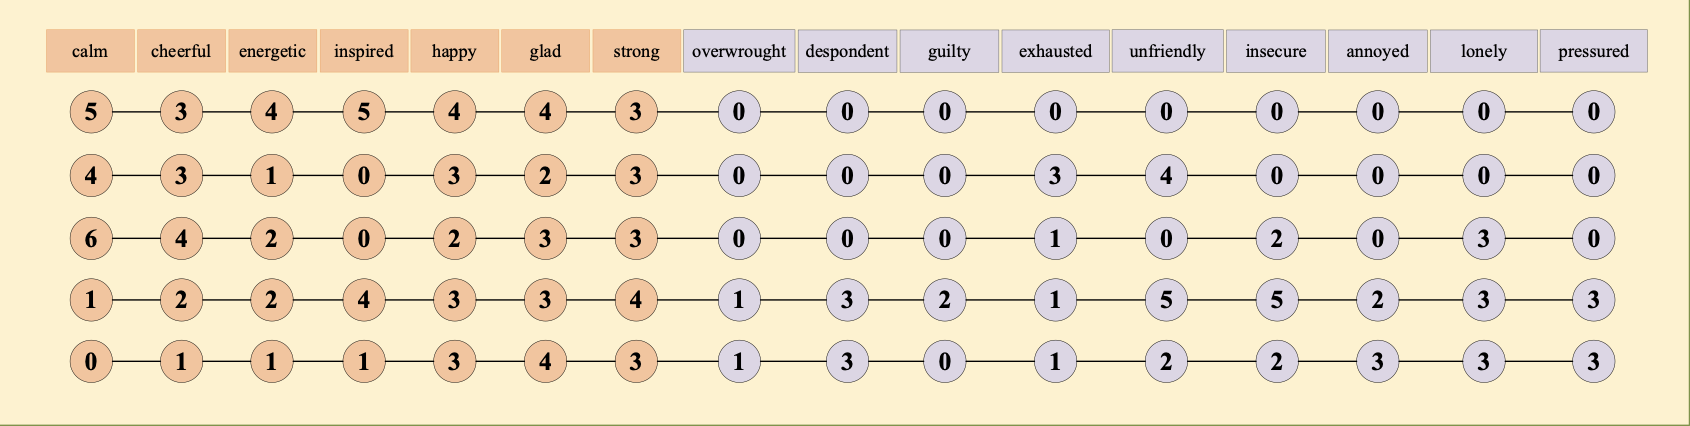
Assessment of response patterns with abnormally high values of the quality indices shows that the distribution of responses in them is partly chaotic, of little intelligibility.Responses to relatively homogeneous items describing positive or negative emotions alternate with high amplitude. These patterns often feature alternating marginal responses, which are difficult to explain in terms of psychological meaning. As in the case of responses with low quality index values, the patterns in this group are removed from further analysis. Thus, the final sample for scientific analysis of the results of players' emotional state assessment with the Emotional EQ was 524072 (19%) response patterns with acceptable response quality indices. Examples of the patterns selected for further analysis are shown in Figure 4.
Thus, out of 2713781 response patterns, 524072response patterns conditionally satisfying valid psychometric assessment requirements were selected as a result of sequential analysis using psychometric IRT technology based on the Rasch model. The technique of selecting valid respondents' answers described in this article can be applied to any data obtained through remote collection of responses to diagnostic items on questionnaires and scales. The application of IRT analysis based on the Rasch model makes it possible to assess the quality of each respondent's answer and to select valid response patterns suitable for further scientific analysis.In general terms, the technique for assessing the validity of players' responses looks as follows.
1. Obtaining a data sample
2. Removing patterns with identical responses
3. IRT analysis of the leftover responses based on the Rasch model
4. Estimation of index values of the quality of respondents' answers
5. Removing the response patterns with abnormally low and abnormally high values of the quality indices
6. Further analysis of the remaining data


.jpg)


