


ABSTRACT. Sleep quality has a significant impact on mental and emotional well-being, daily functioning, and productivity. Challenges such as stress, medical conditions, and irregular sleep patterns often result in poor sleep quality. Both self-reported and objective measures can be used to assess sleep quality. Smartphones and wearable sensors have become popular tools for sleep monitoring, providing convenient data collection with standardized methods.
The aim of this study was to evaluate the sleep quality of Goodville users in the USA using the Goodville Sleep Assessment Questionnaire (GSAQ). The study collected 1,800,000 responses from 4,000 users between April 2021 and September 2022 via the Goodville mobile app and validated the data using Rasch analysis. The study evaluated the prevalence of different sleep onset times, nighttime awakenings, dream frequencies, sleep quality, and awakening quality, and the interrelationships between these sleep quality parameters.
The results showed that half of users fell asleep within 15 minutes, with 23% taking 16-30 minutes, 18% taking 30-60 minutes, and 10% taking over 60 minutes. Approximately half reported never or rarely waking at night, while 34% reported moderate waking, 7% reported waking for 30-60 minutes, and 8% reported waking often. 24% reported never experiencing dreams, 41% reported experiencing dreams sometimes, 21% reported experiencing dreams on average, 11% reported experiencing multiple dreams each night, and 3% reported frequently disturbing dreams. Half rated their sleep quality as “Great” or “Good,” while 36% rated it as "Moderate," and 14% rated it as "Bad" or "Very Bad." Awakening quality was rated as "Great" or "Good" by 47%, "Average" by 37%, and "Bad" or "Very Bad" by 16%. The correlation analysis showed significant connections between all parameters, with the strongest correlations between sleep quality and awakening quality (0.72), sleep onset time and nighttime awakenings (0.65), and sleep quality and sleep onset time (0.62). Dream frequency showed moderate correlations with other parameters (0.42 to 0.49).
In conclusion, this study offers novel insights concerning different sleep quality parameters of the US population. The use of a mobile app and a game-like questionnaire for data collection is a novel approach not seen in previous studies, offering significant advantages. These findings contribute to our understanding of sleep and its impact on the population, and can inform the development of interventions to improve sleep quality.
Key words: Goodville, sleep quality parameters, mobile sleep assessment, emotional well-being
Sleep is an essential aspect of our lives and a fundamental component of psychological well-being. The significance of sleep and sleep quality has become a subject of increasing importance in healthcare research in recent years (Nelson et al., 2022). One major reason for this is that sleep disorders have emerged as one of the major challenges of the 21st century, and their effects were exacerbated during the COVID-19 pandemic (Kim et al., 2021; Neculicioiu et al., 2022). Inefficient or poor sleep can be caused by several factors, including the environment, physiological factors, psychological factors, behavioral habits, and physical factors. Insufficient sleep affects people of all ages and populations, regardless of their health status. Sleep is closely linked to mental and emotional disorders, such as depression, anxiety, bipolar disorder, and more, and is currently studied within the context of sleep quality (Gao et al., 2022).
Sleep quality refers to an individual's satisfaction with all aspects of their sleep experience and encompasses four factors: sleep efficiency, sleep latency, sleep duration, and wakefulness (Nelson et al., 2022). Good sleep quality results in feelings of restfulness, normal reflexes, and positive relationships, while poor sleep quality can negatively impact physical and mental health, daily functioning, and productivity (Barros et al., 2019). Poor sleep quality can be caused by various factors, including stress, medical conditions such as sleep disorders or chronic pain, certain medications or substances, irregular sleep patterns, and exposure to bright lights or screens before bedtime. The consequences of inadequate sleep quality include fatigue, irritability, daytime dysfunction, slowed responses, and increased caffeine or alcohol intake (Nelson et al., 2022). According to the Philips Global Sleep Survey 2019, 62% of adults worldwide do not get enough sleep, and sleep disturbances occur in 67% of adults at least once a night (Sleep Statistics 2022: How Much Sleep Does the Average American Get?, n.d.). Approximately 70% of adults in the USA report poor sleep quality once a month, with 50-70 million Americans suffering from sleep-related problems (Liu et al., 2016). Maintaining a regular sleep schedule, practicing relaxation techniques before bed, creating a comfortable sleep environment, and avoiding stimulating activities or substances before sleep are key steps to enhance sleep quality (Armand et al., 2021; Barros et al., 2019; Gao et al., 2022; Nelson et al., 2022). Addressing underlying medical conditions and other factors that affect sleep quality can also help improve overall sleep quality (Garbarino et al., 2021; Liew & Aung, 2021).
Sleep quality assessment is crucial in identifying issues or disorders that may hinder a person's ability to get adequate rest. These can include insomnia, sleep apnea, and restless leg syndrome (Barros et al., 2019; Nelson et al., 2022). With sleep quality assessment, healthcare providers can create a tailored treatment plan to enhance sleep and overall health. Individuals can also monitor their sleep quality to make lifestyle changes that improve sleep, such as having a comfortable sleep environment, avoiding caffeine and electronic devices before bedtime, and maintaining a consistent sleep schedule.
The evaluation of sleep quality can be done through two distinct methods: self-reported and objective measures. Self-reported measures (Kong et al., 2019) are based on individuals' personal accounts of their sleep and encompass methods such as sleep diaries and questionnaires. For instance, sleep diaries require individuals to log their bedtimes, wake times, and any disturbances they experience during the night. Questionnaires, such as the Pittsburgh Sleep Quality Index (PSQI) (Buysse et al., 1989; Carpenter & Andrykowski, 1998; Mollayeva et al., 2016) and Sleep Disorders Questionnaires (Douglass et al., 1994; Kerkhof et al., 2013; Sweere et al., 1998), evaluate different aspects of sleep, including its quality and the presence of sleep disorders.
Objective measures, including polysomnography and actigraphy, use specialized equipment to objectively monitor sleep patterns. Polysomnography is considered the gold standard for sleep assessment (Fino et al., 2020; Jafari & Mohsenin, 2010; Markun & Sampat, 2020) and involves the measurement of brain waves, eye movements, muscle activity, and other physiological parameters during sleep using multiple sensors and electrodes. On the other hand, actigraphy uses a wrist-worn device to gauge movement and light exposure to determine sleep patterns (Acker et al., 2021; Chinoy et al., 2021, 2022; Fekedulegn et al., 2020).
The use of feature phones, smartphones, and wearable sensors for sleep monitoring has seen a marked increase in recent years (Chinoy et al., 2021, 2022; Lecomte et al., 2020). These devices enable real-time collection of physiological, social, emotional, and behavioral data with minimal effort required from users. Mobile applications, particularly those on smartphones, have become a popular choice for evaluating sleep parameters due to the high-quality sensors and computational powers on current-generation smartphones (Chinoy et al., 2021, 2022). Smartphones, due to their personal nature and widespread usage, are considered an ideal device for low-cost, large-scale, and long-term sleep monitoring. The app-based sleep diary is a convenient and acceptable method of recording sleep data, and is preferred over paper-based diaries (Fino & Mazzetti, 2019). Additionally, the smartphone-based sleep applications prompt timely data entry and enable researchers to distinguish between timely and untimely data entry (Austin et al., 2016). Most smartphone-based sleep applications utilize standard sleep assessment methods, including movement detection, audio and video recording, and questionnaires. The built-in accelerometers in smartphones can act as modern actigraphs, detecting wake and sleep from the movement detected by the phone's sensors (Fino et al., 2020; Fino & Mazzetti, 2019). Some apps also compute sleep assessments based on the analysis of sound and noise in the room during sleep. While actigraphy recorded from a smartphone is a close reproduction of standard sleep assessment methods, it's important to consider differences between the two, as research has shown that actigraphic analysis results may vary based on the type of actimeter used and its location on the body (Fino et al., 2020; Fino & Mazzetti, 2019). Questionnaire-based sleep applications are also available and assess sleep quality, distinguishing between poor sleep and sleep disorders. These apps have an advantage over paper or web-based sleep scales due to the constant availability of the phone, leading to higher rates of self-monitoring and self-report adherence (Fino & Mazzetti, 2019). In conclusion, the use of smartphones and wearable sensors for sleep monitoring has become a widely accepted practice, offering a convenient method of recording sleep data using standard sleep assessment methods. Assessing sleep quality is crucial in identifying and treating sleep disorders or issues that may impact an individual's health and well-being, and monitoring sleep quality can assist individuals in making lifestyle changes to improve their sleep.
Goodville, a farming game with mental health and well-being assessments and tracking (Goodville, n.d.), features a sleep assessment tool as well. The Goodville research team designed the Goodville Sleep Assessment Questionnaire (GSAQ) to measure sleep quality in the Goodville community. The GSAQ consists of five items: sleep onset time, nighttime awakenings, dreams, overall sleep quality, and quality of awakening. Each item offers five response categories, ranging from 0 (no difficulty) to 4 (maximum difficulty).
The purpose of the study was to evaluate and analyze sleep quality parameters of Goodville users from the USA based on the GSAQ. This study was conducted from April 2021 to September 2022 and involved a total of 4,000 Goodville users. The study collected 1,800,000 responses through the GSAQ and only analyzed valid responses. The Rasch psychometric technology(Boone, 2016; Boone et al., 2014; da Rocha et al., 2013) was employed to ensure the validity of the data. After a validity check, 600,000 response patterns were used for further analysis. To account for multiple observations per participant, the median of their responses was calculated. As part of the statistical analysis, we assessed the prevalence of different levels of sleep quality, including sleep onset time, nighttime awakenings, dreams, overall sleep quality, and quality of awakening.
The results of the evaluation of sleep start time among Goodville users in the USA, shown in a pie chart (Figure 1), provide a comprehensive insight into the sleep patterns of individuals.
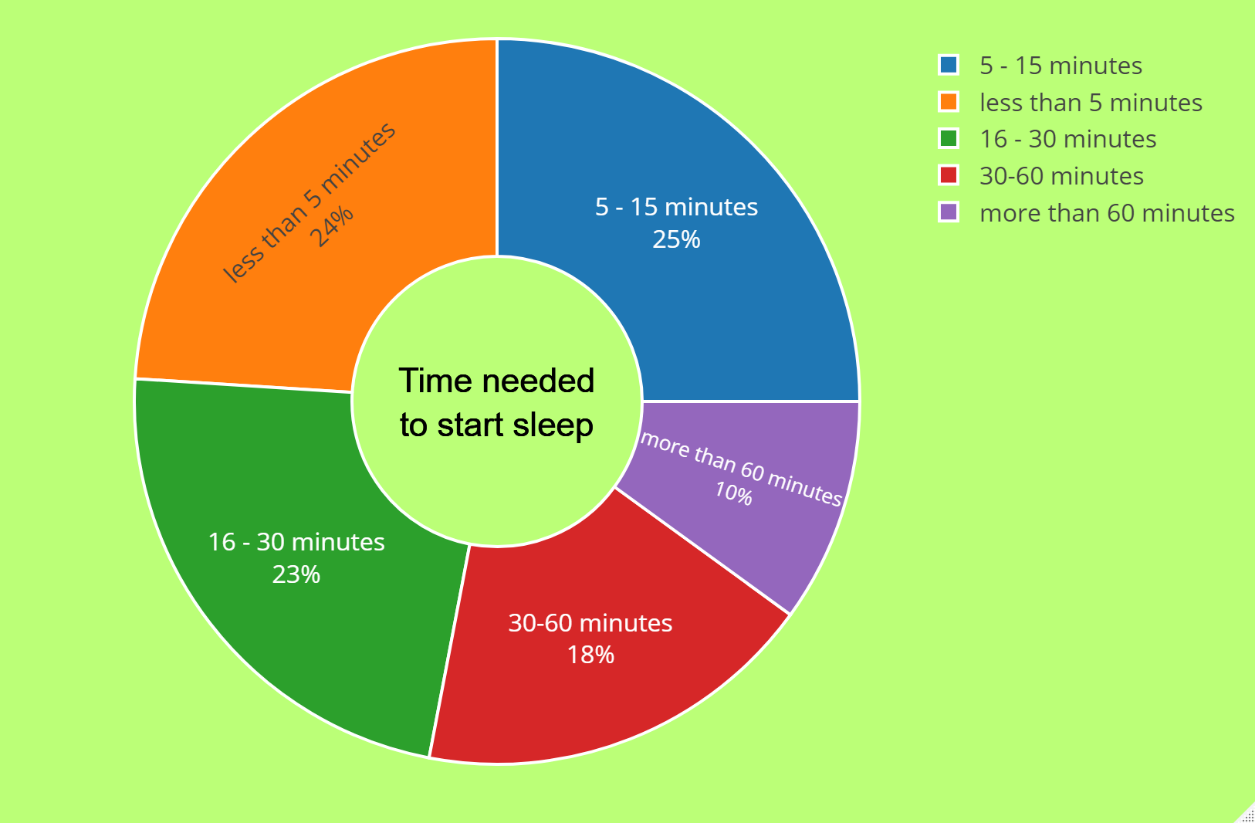
According to the pie chart, 24% of users fell asleep in less than 5 minutes, which can be viewed as a relatively fast onset of sleep. A quarter of users needed between five and fifteen minutes to drift off to sleep, a moderate time frame. It is worth mentioning that 23% of users took 16-30 minutes to begin sleeping, which can be considered a slightly longer onset of sleep but still lies within the normal range. Also, 18% of users took 30-60 minutes to fall asleep compared to the previous categories, indicating a longer onset of sleep. This may suggest that these individuals have difficulty falling asleep or may have sleep disorders that need to be addressed. On the other hand, only 10% of users took more than 60 minutes to drift off to sleep. This can be considered a significantly longer onset of sleep and may warrant medical attention.
Pie charts (Figure 2) depict the nighttime waking patterns of US Goodville users based on the Goodville Sleep Assessment Questionnaire.
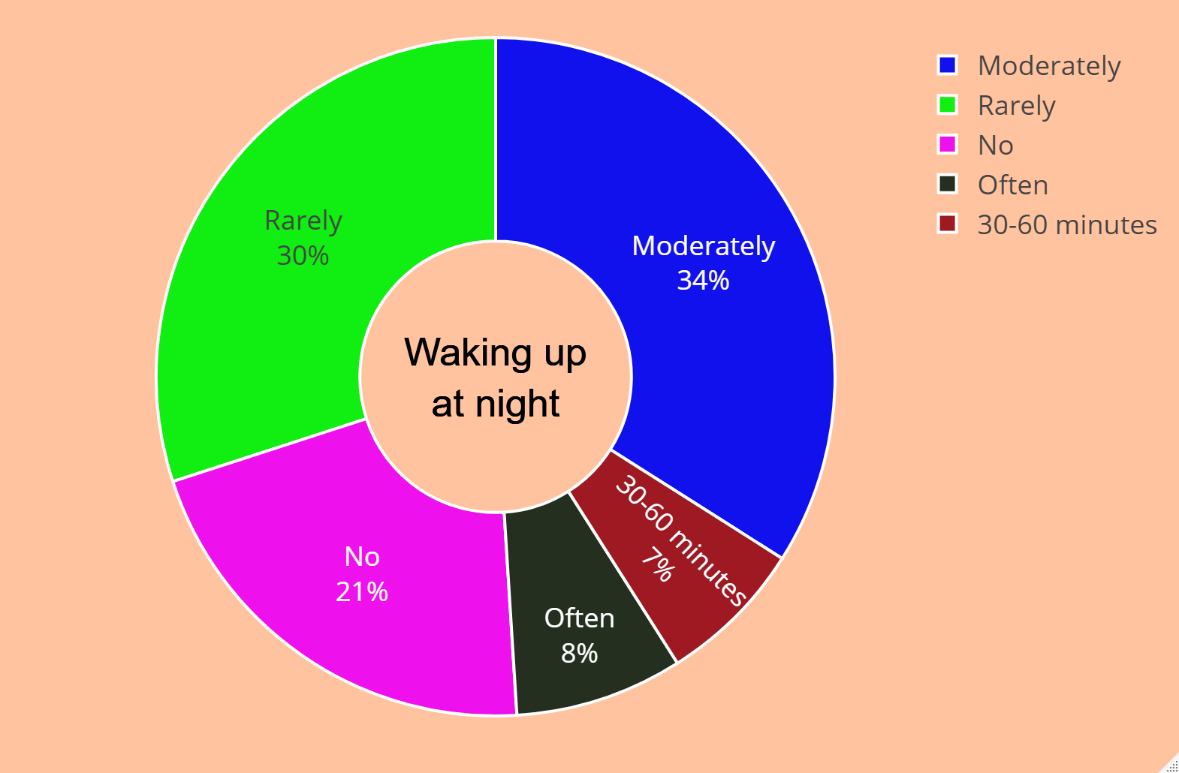
According to the pie chart, 21% of users never had to get up at night, which can be regarded as an ideal sleep pattern. The second group consists of 30% of users who rarely needed to wake up in the middle of the night, a frequency that can be considered acceptable. There were 34% of users who woke up moderately at night, suggesting that they were not getting enough quality sleep. As compared to the previous category, 7% of users were awake for a long time (30-60 minutes) at night. Having difficulty falling back to sleep after staying up may indicate that these individuals have sleep disorders that need to be addressed. Additionally, 8% of users often wake up at night, which may require medical attention if it is a frequent occurrence.
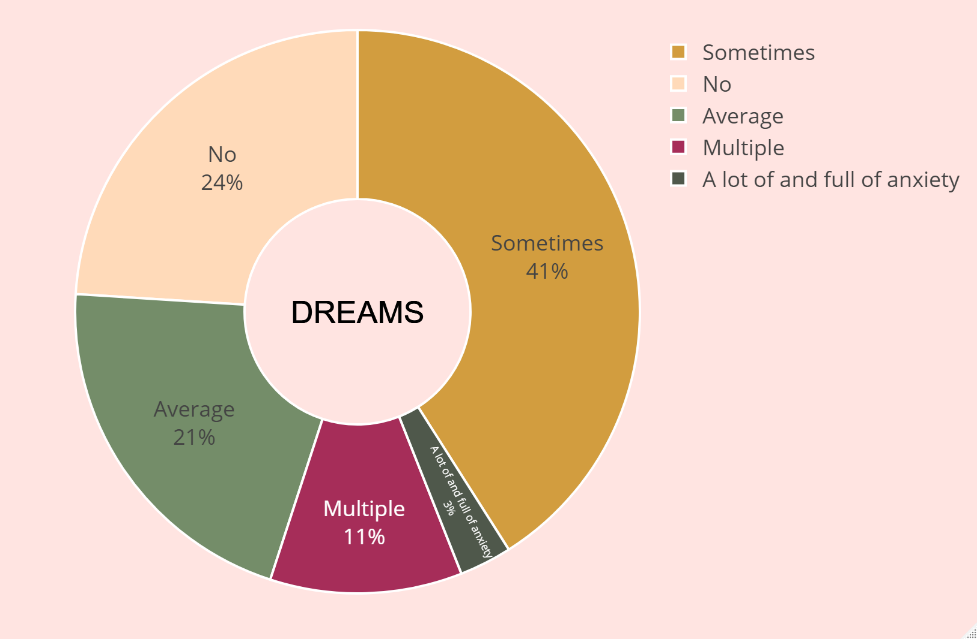
The pie chart (Figure 3) depicting the frequency of dreams among Woodville users in the USA provides a view of the dream landscape. The results obtained are quite fascinating. According to the pie chart, 24% of users indicated they never experience dreams at night, which is a relatively uncommon occurrence. A moderate number of 41% of users, reported sometimes having dreams. 21% of users stated they dream on average, considered a reasonable level of dreaming and an essential component of quality sleep. 11% of users noted they have multiple dreams each night, a higher rate than in other categories. This may suggest issues with sleep quality for these individuals due to their vivid and intense dreams. Only 3% of users indicated they have frequent disturbing dreams filled with anxiety, indicating a need for medical or psychological assistance.
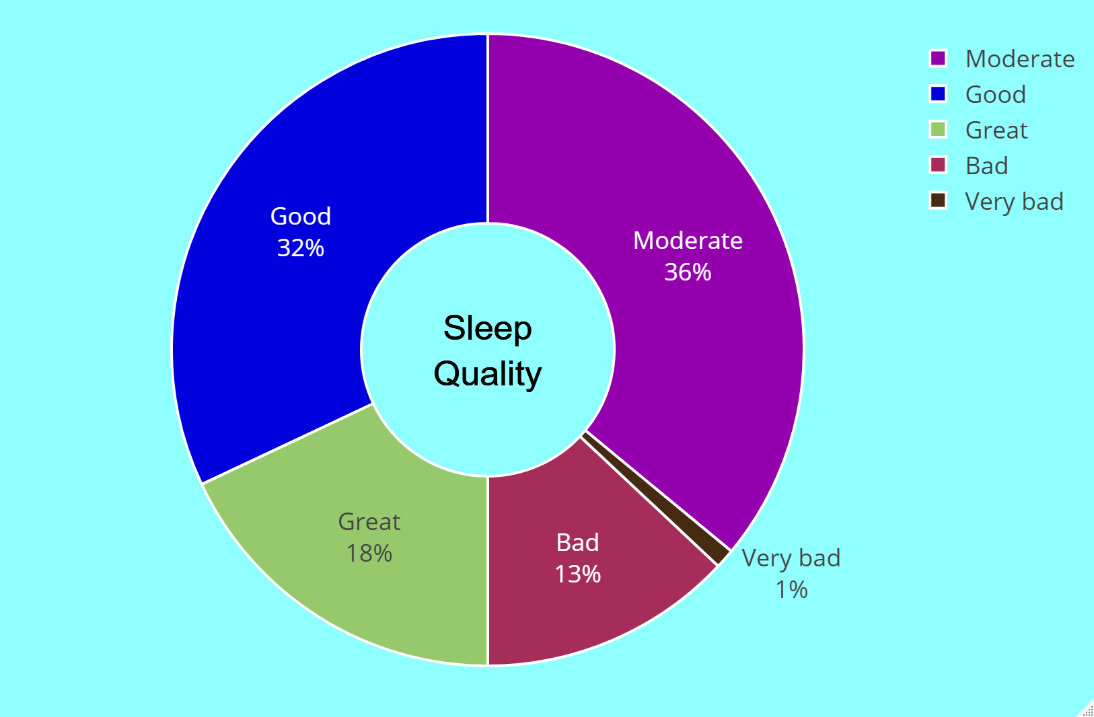
The results of the sleep quality assessment among users of the Goodville app from the USA are depicted in Figure 4 using a pie chart. There were 18% of respondents who rated their sleep quality as "Great", and 32% who rated it as "Good". A total of 36% of the participants reported "Moderate" sleep quality, while 13% stated "Bad" sleep quality. Only 1% of respondents assessed their sleep quality as "Very Bad". The results of the survey indicate a diverse range of sleep quality among Goodville app users in the US. A majority of the respondents (50%) expressed either "Good" or "Great" sleep quality, which is a positive finding. However, a substantial proportion of the participants (49%) reported either "Moderate", "Bad", or "Very Bad" sleep quality, indicating a need for further investigation and intervention.
The pie chart in Figure 5 shows the results of the assessment of awakening quality among Goodville app users in the USA.
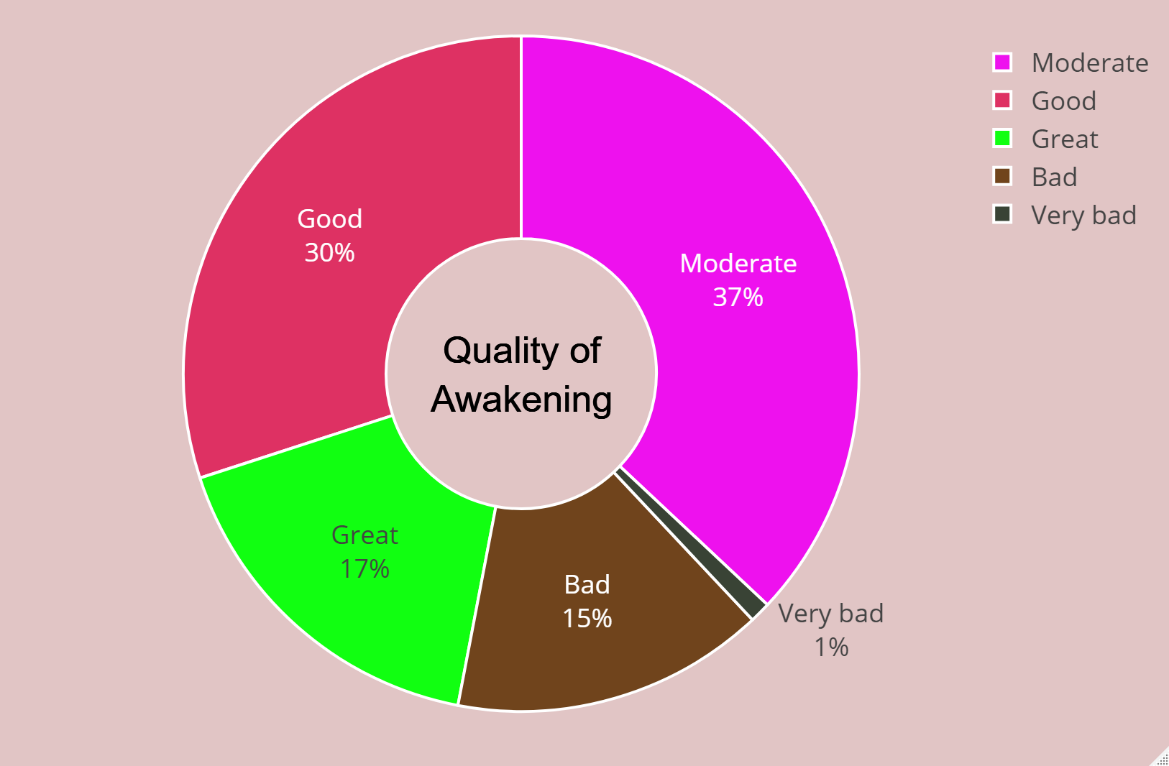
Among the respondents, 17% rated their awakening quality as "Great", 30% as "Good", 37% as "Average", 15% as "Bad", and only 1% as "Very Bad". This study offers a glimpse into the diverse range of wake-up quality experiences among Goodville app users in the USA. Almost half of the participants (47%) mentioned "Good" or "Great" awakening quality, indicating a positive trend. There however substantial numbers of respondents (52%) who indicated either "Average", "Bad", or "Very Bad" waking quality, suggesting further research is needed into what factors influence awakening quality. It is worth noting that only 16% of respondents rated their wake-up quality as "bad".
The results of the correlations between the different sleep quality parameters among US Gooville users are presented in Figure 6.
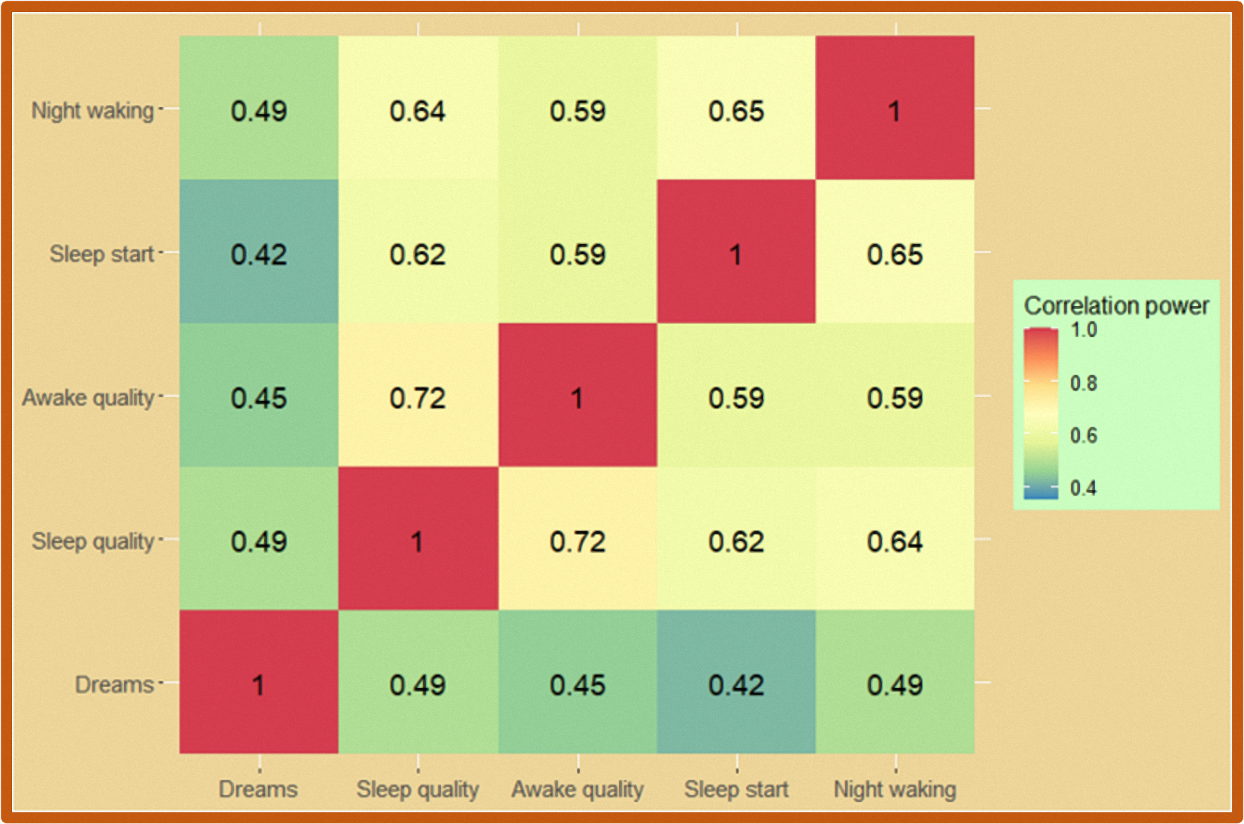
The results of the correlations between the different sleep quality parameters among US Goodville users are presented in Figure 6. The heatmap illustrates the correlation coefficients between all five sleep quality parameters. Correlations were computed using Pearson's correlation coefficient, which ranges from -1 to 1, where -1 represents a strong negative correlation, 0 represents no correlation, and 1 represents a strong positive correlation. The heatmap displays stronger positive correlations in red, weaker positive or negative correlations in yellow, and stronger negative correlations in blue. The results indicate that there were significant connections between all sleep quality parameters. The strongest correlations were observed between sleep quality and awakening quality, with a coefficient of 0.72, indicating a highly positive association between the two variables. As a result of this finding, people with low awakening quality tend to have low sleep quality and vice versa. Another significant correlation was noted between sleep onset time and nighttime awakenings, with a coefficient of 0.65. This suggests that individuals who take longer to fall asleep are more likely to wake up during the night. Sleep quality and sleep onset time were also significantly correlated, with a coefficient of 0.62, indicating that people who take longer to fall asleep are more likely to report lower sleep quality, and vice versa. Dream frequency was moderately correlated with other sleep quality parameters, with coefficients ranging from 0.42 to 0.49. As a result, dream frequency was moderately related to other sleep quality parameters, but the relationship was not as strong as between other variables.
Sleep is a fundamental aspect of human life and plays a crucial role in ensuring optimal physical and mental functioning. Despite its importance, a significant proportion of the population experiences difficulties in falling and staying asleep. In this study, the sleep patterns of a large sample of individuals were explored using the Goodville Sleep Assessment Questionnaire (GSAQ). The GSAQ was designed as a mobile game to make the questionnaire accessible and engaging for participants. The study was conducted between April 2021 and September 2022, involving a total of 4,000 Goodville users. The validity of the data was ensured through the Rasch psychometric system, and only valid responses were analyzed.
The results showed that half of the users reported falling asleep within 15 minutes, with almost a quarter taking 16-30 minutes, 18% taking 30-60 minutes, and 10% taking over 60 minutes. These findings provide insight into the time frame for users to fall asleep, which is a crucial factor in determining sleep quality. The results also showed that approximately half of the users reported either never waking or waking only rarely during the night, while one third indicated moderate waking, 7% indicated waking for 30-60 minutes, and 8% indicated waking often. These data provide valuable insight into the sleep patterns of individuals and can be used to understand the factors that contribute to nighttime waking. The frequency of dreams was also explored, with 24% of individuals reporting not having any dreams, 41% experiencing dreams sometimes, 21% dreaming on average, 11% having multiple dreams per night, and 3% having frequent disturbing dreams. Dreaming is linked to improved cognitive function and emotional health, and is considered a normal part of healthy sleep (Nir & Tononi, 2010). However, not all dreams have a positive impact on sleep. Bad dreams and nightmares can cause restlessness, frequent awakenings, and even avoidance of sleep, leading to the risk of insomnia and sleep deprivation (Nielsen & Levin, 2007). This is known as nightmare disorder (Paul et al., 2015). The results of the study showed moderate correlations between dream frequency and other sleep quality parameters, indicating that dream frequency should not be disregarded as a factor affecting sleep quality. The sleep quality and awakening quality assessment showed that while a significant portion of participants rated their sleep quality as "Good" or "Great," a substantial number rated it as "Moderate" or lower, highlighting the need for interventions to improve sleep quality in the population. The results of correlation analysis showed significant relationships between all five sleep parameters, with the strongest correlations found between sleep quality and awakening quality (coefficient of 0.72) and between sleep start time and nighttime wakings (coefficient of 0.65).
In conclusion, this study provides novel insights into the interrelationships between different sleep quality parameters, highlighting the importance of considering multiple factors when evaluating sleep quality. The mobile format of the assessment used in this study is a significant advantage and the game-like format of the questionnaire is a novel approach that has not been used in previous studies. These findings contribute to the understanding of sleep and its effects on the population, and can inform the development of interventions to improve sleep quality.
You can download full version of this article here
References
Acker, J. G., Becker-Carus, C., Büttner-Teleaga, A., Cassel, W., Danker-Hopfe, H., Dück, A., Frohn, C., Hein, H., Penzel, T., Rodenbeck, A., Roenneberg, T., Sauter, C., Weeß, H. G., Zeitlhofer, J., & Richter, K. (2021). The role of actigraphy in sleep medicine. In Somnologie (Vol. 25, Issue 2). https://doi.org/10.1007/s11818-021-00306-8
Armand, M. A., Biassoni, F., & Corrias, A. (2021). Sleep, Well-Being and Academic Performance: A Study in a Singapore Residential College. Frontiers in Psychology, 12. https://doi.org/10.3389/FPSYG.2021.672238
Austin, D., Johnstone, N., Papadopoulos, N., & Rinehart, N. (2016). Recording sleep behaviour via sleep diaries: feasibility of a smartphone “app” and its equivalence to a paper diary. Journal of Intellectual Disability Research, 60(7‐8), 631‐. https://www.cochranelibrary.com/central/doi/10.1002/central/CN-01735601/full
Barros, M. B. de A., Lima, M. G., Ceolim, M. F., Zancanella, E., & Cardoso, T. A. M. de O. (2019). Quality of sleep, health and well-being in a population-based study. Revista de Saude Publica, 53, 82. https://doi.org/10.11606/S1518-8787.2019053001067/1518_8787_RSP_53_82_PDF.PDF
Boone, W. J. (2016). Rasch analysis for instrument development. Life Sciences Educ., 15(4), 1–7.
Boone, W. J., Staver, J. R., & Yale, M. S. (2014). Rasch Analysis in the Human Sciences. In Book. https://doi.org/10.1007/978-94-007-6857-4
Buysse, D. J., Reynolds, C. F., Monk, T. H., Berman, S. R., & Kupfer, D. J. (1989). The Pittsburgh sleep quality index: A new instrument for psychiatric practice and research. Psychiatry Research, 28(2), 193–213. https://doi.org/10.1016/0165-1781(89)90047-4
Carpenter, J. S., & Andrykowski, M. A. (1998). Psychometric evaluation of the Pittsburgh Sleep Quality Index. Journal of Psychosomatic Research, 45(1), 5–13. https://doi.org/10.1016/S0022-3999(97)00298-5
Chinoy, E. D., Cuellar, J. A., Huwa, K. E., Jameson, J. T., Watson, C. H., Bessman, S. C., Hirsch, D. A., Cooper, A. D., Drummond, S. P. A., & Markwald, R. R. (2021). Performance of seven consumer sleep-tracking devices compared with polysomnography. Sleep, 44(5). https://doi.org/10.1093/sleep/zsaa291
Chinoy, E. D., Cuellar, J. A., Jameson, J. T., & Markwald, R. R. (2022). Performance of Four Commercial Wearable Sleep-Tracking Devices Tested Under Unrestricted Conditions at Home in Healthy Young Adults. Nature and Science of Sleep, 14. https://doi.org/10.2147/NSS.S348795
da Rocha, N. S., Chachamovich, E., de Almeida Fleck, M. P., & Tennant, A. (2013). An introduction to Rasch analysis for Psychiatric practice and research. Journal of Psychiatric Research, 47(2), 141–148. https://doi.org/10.1016/j.jpsychires.2012.09.014
Douglass, A. B., Bornstein, R., Nino-Murcia, G., Keenan, S., Miles, L., Zarcone, V. P., Guilleminault, C., & Dement, W. C. (1994). The Sleep Disorders Questionnaire I: Creation and multivariate structure of SDQ. Sleep, 17(2), 160–167. https://doi.org/10.1093/sleep/17.2.160
Fekedulegn, D., Andrew, M. E., Shi, M., Violanti, J. M., Knox, S., & Innes, K. E. (2020). Actigraphy-based assessment of sleep parameters. In Annals of Work Exposures and Health (Vol. 64, Issue 4). https://doi.org/10.1093/ANNWEH/WXAA007
Fino, E., & Mazzetti, M. (2019). Monitoring healthy and disturbed sleep through smartphone applications: a review of experimental evidence. In Sleep and Breathing (Vol. 23, Issue 1, pp. 13–24). Springer Verlag. https://doi.org/10.1007/s11325-018-1661-3
Fino, E., Plazzi, G., Filardi, M., Marzocchi, M., Pizza, F., Vandi, S., & Mazzetti, M. (2020). (Not so) Smart sleep tracking through the phone: Findings from a polysomnography study testing the reliability of four sleep applications. Journal of Sleep Research, 29(1). https://doi.org/10.1111/jsr.12935
Gao, C., Guo, J., Gong, T. T., Lv, J. le, Li, X. Y., Liu, F. H., Zhang, M., Shan, Y. T., Zhao, Y. H., & Wu, Q. J. (2022). Sleep Duration/Quality With Health Outcomes: An Umbrella Review of Meta-Analyses of Prospective Studies. Frontiers in Medicine, 8. https://doi.org/10.3389/FMED.2021.813943
Garbarino, S., Lanteri, P., Bragazzi, N. L., Magnavita, N., & Scoditti, E. (2021). Role of sleep deprivation in immune-related disease risk and outcomes. Communications Biology, 4(1). https://doi.org/10.1038/S42003-021-02825-4
Goodville. (n.d.). Retrieved February 8, 2023, from https://www.goodville.me/
Jafari, B., & Mohsenin, V. (2010). Polysomnography. In Clinics in Chest Medicine (Vol. 31, Issue 2, pp. 287–297). https://doi.org/10.1016/j.ccm.2010.02.005
Kerkhof, G. A., Geuke, M. E. H., Brouwer, A., Rijsman, R. M., Schimsheimer, R. J., & van Kasteel, V. (2013). Holland Sleep Disorders Questionnaire: A new sleep disorders questionnaire based on the International Classification of Sleep Disorders-2. Journal of Sleep Research, 22(1). https://doi.org/10.1111/j.1365-2869.2012.01041.x
Kim, H., Hegde, S., Lafiura, C., Raghavan, M., Luong, E., Cheng, S., Rebholz, C. M., & Seidelmann, S. B. (2021). COVID-19 illness in relation to sleep and burnout. BMJ Nutrition, Prevention and Health, 4(1), 132–139. https://doi.org/10.1136/BMJNPH-2021-000228
Kong, N., Choi, J., & Seo, W. S. (2019). Evaluation of sleep problems or disorders using sleep questionnaires. In Chronobiology in Medicine (Vol. 1, Issue 4, pp. 144–148). Korean Society of Sleep Medicine. https://doi.org/10.33069/cim.2019.0028
Lecomte, T., Potvin, S., Corbière, M., Guay, S., Samson, C., Cloutier, B., Francoeur, A., Pennou, A., & Khazaal, Y. (2020). Mobile apps for mental health issues: Meta-review of meta-analyses. JMIR MHealth and UHealth, 8(5). https://doi.org/10.2196/17458
Liew, S. C., & Aung, T. (2021). Sleep deprivation and its association with diseases- a review. Sleep Medicine, 77, 192–204. https://doi.org/10.1016/J.SLEEP.2020.07.048
Liu, Y., Wheaton, A. G., Chapman, D. P., Cunningham, T. J., Lu, H., & Croft, J. B. (2016). Prevalence of Healthy Sleep Duration among Adults — United States, 2014. MMWR. Morbidity and Mortality Weekly Report, 65(6). https://doi.org/10.15585/mmwr.mm6506a1
Markun, L. C., & Sampat, A. (2020). Clinician-Focused Overview and Developments in Polysomnography. In Current Sleep Medicine Reports (Vol. 6, Issue 4, pp. 309–321). Springer Science and Business Media Deutschland GmbH. https://doi.org/10.1007/s40675-020-00197-5
Mollayeva, T., Thurairajah, P., Burton, K., Mollayeva, S., Shapiro, C. M., & Colantonio, A. (2016). The Pittsburgh sleep quality index as a screening tool for sleep dysfunction in clinical and non-clinical samples: A systematic review and meta-analysis. Sleep Medicine Reviews, 25, 52–73. https://doi.org/10.1016/J.SMRV.2015.01.009
Neculicioiu, V. S., Colosi, I. A., Costache, C., Sevastre-Berghian, A., & Clichici, S. (2022). Time to Sleep?—A Review of the Impact of the COVID-19 Pandemic on Sleep and Mental Health. International Journal of Environmental Research and Public Health, 19(6). https://doi.org/10.3390/IJERPH19063497
Nelson, K. L., Davis, J. E., & Corbett, C. F. (2022). Sleep quality: An evolutionary concept analysis. Nursing Forum, 57(1), 144–151. https://doi.org/10.1111/NUF.12659
Nielsen, T., & Levin, R. (2007). Nightmares: A new neurocognitive model. Sleep Medicine Reviews, 11(4), 295–310. https://doi.org/10.1016/j.smrv.2007.03.004
Nir, Y., & Tononi, G. (2010). Dreaming and the brain: from phenomenology to neurophysiology. Trends in Cognitive Sciences, 14(2), 88–100. https://doi.org/10.1016/J.TICS.2009.12.001
Paul, F., Schredl, M., & Alpers, G. W. (2015). Nightmares affect the experience of sleep quality but not sleep architecture: an ambulatory polysomnographic study. Borderline Personality Disorder and Emotion Dysregulation, 2(1). https://doi.org/10.1186/S40479-014-0023-4
Sleep statistics 2022: How much sleep does the average American get? (n.d.). Retrieved December 27, 2022, from https://www.singlecare.com/blog/news/sleep-statistics/
Sweere, Y., Kerkhof, G. A., de Weerd, A. W., Kamphuisen, H. A. C., Kemp, B., & Schimsheimer, R. J. (1998). The validity of the Dutch sleep disorders questionnaire (SDQ). Journal of Psychosomatic Research, 45(6). https://doi.org/10.1016/S0022-3999(98)00030-0


.jpg)


