


SUMMARY. The increasing use of mobile devices such as smartphones, tablets, and wearable sensors has made them a valuable tool for collecting various types of psychological data. However, it is crucial to ensure that the data collected aligns with the intended purpose and is valid and reliable. Modern item-response theories, such as Rasch Measurement Theory (RMT), hold promising potential for designing items in mobile apps that measure a specific construct.
This study aimed to determine effective criteria for selecting valid responses from big data samples obtained through mobile applications for questionnaires based on Rasch person fit statistics.
The study focused on the Goodville app's version of the Quick Inventory of Depressive Symptomatology (QIDS-SR16) items to determine the validity of users' responses. The analysis included ten QIDS-SR16 items and evaluated 275,799 responses from US Goodville users between April 2021 and September 2022 using Rasch analysis and four fit statistics indices to assess the validity of responses. Two groups of data were selected for validity evaluation, with one group having invalid responses on appetite and weight items and the other having adequate responses.
The study found that the unweighted mean square index (UMS) overestimated invalidity if the validity was unknown in advance. The weighted mean square index (WMS) was better at identifying systematic irregular responses, while the UMS was better at identifying invalid patterns with large discrepancies between expected and observed responses. Outliers should be excluded when selecting valid response patterns. The standardized versions of fit statistics were ineffective in identifying invalid responses. The best way to evaluate respondents' response patterns is to use non-standardized UMS and WMS fit statistics and a threshold value of 1.5. Any pattern with person fit statistics greater than 1.5 should not be considered suitable for further analysis.
Conclusion: The study concludes that Rasch analysis and fit statistics can be effectively used to evaluate the validity of mobile psychological data. However, the results highlight the importance of selecting appropriate fit statistics and criteria for determining valid responses. The study's findings can guide the development of mobile questionnaires that are more reliable and valid, leading to better treatment decisions and tracking of therapeutic responses.
Key words: Goodville, mobile psychological assessment, Rasch fit statistics
Smartphones, tablets, and wearable sensors are increasingly popular every year. These devices can collect various types of data, including physiological, social, emotional, and behavioral data, with little effort from the client (Areán et al., 2016). Due to their capabilities, smartphones have become an essential tool in psychological research. Mobile questionnaires are an effective method for collecting subjective psychological data (Harari et al., 2016). This data can inform treatment decisions and track therapeutic responses (Areán et al., 2016).
Developing behavioral measures requires a psychological approach that considers reliability, validity, and generalizability (Harari et al., 2016; Rüegger et al., 2020). Inferences made from smartphone data may underestimate or overestimate certain behaviors, making this area of research critical for future studies. The validity and reliability of clinical outcome assessments are essential in mental health apps (Wang et al., 2018). Using untested tools may produce false results. Many mobile mental health applications use well-known and psychometrically sound assessment tools, but they are often used blindly in a new format. Respondents may not have clear guidance when answering questions in a mobile application.
The Goodville app is a mobile game that includes an emotional wellness assessment module. This module includes a range of self-assessment questionnaires for screening depression (QIDS-SR16, PHQ-8) and anxiety (GAD-7). Participants from different groups can participate in this gamified emotional health assessment. However, game motivation may negatively affect the accuracy of questionnaire responses. Some respondents may answer items incorrectly due to a lack of motivation, leading to players clicking on the same response categories or providing random answers without reading the items' content. Despite this, a substantial portion of participants is expected to provide accurate emotional health information. Therefore, it is crucial to determine to what extent mobile psychological data obtained align with the diagnostic purpose stated in the data collection.
It is important to ensure that data acquired by mobile devices captures the concept of interest, such as depression or anxiety. Interpretation of the data is based on total scores, thus requiring a suitable measurement model to ensure that the summary score obtained is valid and measurable from a psychometric perspective (Embretson & Reise, 2013; Mari et al., 2021). The underlying theory specifies how indicators, such as items related to a construct (e.g. depression), must be used to measure the construct. A person's endorsement of an item should be determined only by their ability (e.g. depression) and not by other factors (Mari et al., 2021; McClimans et al., 2017; Mohamad et al., 2015). For example, an individual who is more depressed is more likely to endorse an item describing low energy level than an individual who is not depressed. Even though this item does not measure depression directly, it contributes to a depression total score when combined with other items related to depression.
Traditional self-reported outcome questionnaires have been evaluated using classical test theory (CTT) since the 1930s (Cappelleri et al., 2014). However, when evaluating mobile test data, CTT does not provide methods for detecting fake (invalid) responses, resulting in significantly less accurate and valid study results since all mobile data is accepted as valid (Cappelleri et al., 2014; De Champlain, 2010; Embretson & Reise, 2013; McClimans et al., 2017). Thus, the shortcomings of this theory have led to significant changes in the last few decades, and modern item-response theories (IRT), such as Rasch Measurement Theory (RMT), have been introduced to determine the psychometric requirements for designing items for mobile apps that are supposed to measure a particular construct (Mari et al., 2021; McClimans et al., 2017; Mohamad et al., 2015).Recent research has shown that modern statistical approaches like RMT can contribute to the improvement of diagnostic instruments.
One desirable attribute of RMT is its interval scale levels of model parameters, sample-free calibration of tests, and item-free measurement of individuals. In the RMT framework, an unidimensional relationship is calculated between item difficulty (e.g. depression level expressed by the item) and person ability level (e.g. depression level) by evaluating the number of positive and negative endorsements and expressing the difference as log-odds. The RMT uses a logistic function to relate the likelihood of an individual endorsing an item to the difference between the level of ability and the level of difficulty. Unlike other measurement models, the RMT integrates a total score with an analysis of individual responses, allowing for estimation of model parameters using a summary score. During the model measurement process, Rasch analysis determines if the total score is a sufficient statistic for assessing the severity of the ability measured (Engelhard, 2013).
Mobile psychological data must agree with the model predictions to achieve the properties of the Rasch model. Empirical data must fit the model predictions to achieve the Rasch model's properties. Rasch fit statistics indicate whether the data fits a model well and whether the mobile measurement scale is useful (Andrich & Marais, 2019). In fact, Rasch fit statistics are chi-squares divided by degrees of freedom, also known as mean-squares. They are calculated by squaring the differences between the observed and predicted responses and averaging these residuals (B. D. Wright & Masters, 1990). Rasch fit statistics are divided into two categories. Person fit statistics measure how well a person's responses to the items match the model's predictions. Item fit statistics indicate how well items contribute to a one-dimensional scale. For each class, two chi-square statistics, Outfit and Infit, are calculated to determine the quality of respondent responses and items (Andrich & Marais, 2019; Green & Frantom, 2002).
The Outfit includes standardized on expected response dispersion mean square (UMS) residuals that are averaging on items (person UMS) and respondents (item UMS). The Infit can be expressed as nonstandardized mean square residuals that are weighted on the summary dispersion of expected responses for persons (person WMS) and for items (item WMS). Both UMS and WMS have standardized versions based on the normal Z-distribution and expressed in standard Z-units. Wilson-Hilferty cubic transformation is used to standardize mean squares (B. D. Wright & Masters, 1990). Thus, in RMT, four fit indices are calculated for each person and item: UMS, WMS, and their standardized versions ZstdUMS and ZstdWMS.
In the context of the article, person fit statistics are of particular interest. Person fit indices are indicators of whether individuals respond to items consistently or whether they respond idiosyncratically or irregularly. Inattentiveness, boredom, confusion, or unusual salience may alter people's responses, which may be inconsistent. The respondent can simply choose the same predictable answers to the questionnaire items if he is in a hurry or does not want to strain himself. By using Rasch person fit statistics, it is possible to select invalid response patterns that are unsuitable for mobile psychological measurement. In general, responses with mean square fit statistics between 0.50 and 1.50 (B. D. Wright, 1994) are considered productive for measurement, while fit statistics less than 0.50 are highly predictive with little dispersion. Fit statistics above 1.5 distort measurement due to irregular, inconsistent, or bizarre structure. As for standardized statistics, values between -2.0 and 2.0 (Embretson & Reise, 2013; B. D. Wright & Masters, 1990) are appropriate for measurement, less than -2.0 are excessively predictive, and above 2.0 are distorted. The rationale behind these criteria is mainly theoretical. They are primarily used to assess the quality of items. The application of these values of fit statistics to evaluating respondents' responses remains unclear. Behind this, the UMS (outfit) considers unexpected responses provided by people who give irregular, chaotic, and invalid responses. Its value increases as the data sample exhibits more unpredictable response patterns. The WMS is information-weighted; it emphasizes residuals from well-matched person-item encounters and places less attention on residuals from highly unexpected responses. Due to the possibility of a significant number of unexpected or invalid responses in big data samples obtained through mobile assessments, the values of both person fit statistics may differ significantly.
There are no empirical studies on which type of Rasch person fit statistics is more informative for selecting valid responses from samples of big data obtained during a mobile psychological testing.
The aim of this study was to determine the most effective criteria for selecting valid responses from big data samples obtained using mobile applications for questionnaires based on Rasch person fit statistics.
A validity analysis was conducted regarding the items of the Quick Inventory of Depressive Symptomatology (QIDS-SR16). The QIDS-SR16 was developed in 2000 using items from the 30-item Inventory of Depressive Symptomatology (Bernstein et al., 2010; Brown et al., 2008; A. J. Rush et al., 2003; Trivedi et al., 2004). It consists of 16 items, which are transformed into nine domains of the DSM-IV symptom profile for major depression. Items 1-4 describe different types of sleep disturbance. Item 5 evaluates depressive mood. Items 6 and 7 describe decreased and increased appetite, respectively. Weight loss and weight gain are the topics of items 8 and 9. The next items evaluate symptoms of depression such as difficulties concentrating (item 10), self-criticism (item 11), suicidal thoughts (item 12), low interest (item 13), and low energy (item 14). Symptoms of depression associated with the last two items (15 and 16) include slowness and restlessness. Each item score ranges from 0 to 3, with higher scores indicating greater psychopathology ( J. Rush et al., 2003).
The QIDS-SR16 was used to determine the criteria for determining the validity of responses because of the unique features of the item set. There are some items on the questionnaire that evaluate states that are in opposition to each other, such as "decreased appetite" and "increased appetite", "decreased weight" and "increased weight", and "slowness" and "restlessness". Since the questionnaire evaluates the respondent's state over the past seven days, it is unlikely that the person could have both significantly reduced and significantly increased their appetite or weight during that time period.
For example, response category 2 on the item "reduced appetite" includes the statement: "I eat much less than usual and only with personal effort," while the equivalent response category on the item "increased appetite" says: "I regularly eat more often and/or greater amounts of food than usual." There is little chance that the respondent will have to eat hard within 7 days and take more food than usual on a regular basis. Accordingly, the response category 3 content of the "decreased weight" item includes "I have lost 5 pounds or more," while the similar response category content of the "increased weight" item includes "I have gained 5 pounds or more". Generally, it is impossible to gain 5 pounds or more and immediately lose them within 1-2 weeks.
Among the QIDS-SR16 items, "decreased appetite" and "decreased weight" reflect typical symptoms of depression, while "increased appetite" and "increased weight" measure atypical symptoms. A person with depression cannot experience typical and atypical somatic symptoms at the same time. To a lesser extent, a similar situation may affect items "slowness" and "restlessness". Feelings of slowdown and restlessness in depression, however, are not as stable as appetite and body weight symptoms. Thus, when the respondent selects the maximum response categories for items "reduced appetite" and "reduced weight", it is expected that they will choose zero responses for "increased appetite" and "increased weight", indicating the absence of these symptoms. Having high scores on all of these items cannot be considered valid, since a person cannot experience the opposite somatic symptoms of depression within a short period of time. Therefore, high-scoring patterns of respondents' responses regarding "reduced appetite" and "increased appetite" or "reduced weight" and "increased weight" can be considered to be clear indicators of invalid responses.
Person fit statistics are calculated using functional relationships between model parameters (item difficulty, ability, and total score) without considering the content of items. Generally, these functional relations follow the law of order. According to this law, the higher the total score on the scale, the higher the category of answers expected. There is no contradiction between all the items in this case, and the scale is evaluated as constructively valid. Consequently, if all the answers to the items "decreased appetite," "increased appetite," "decreased weight," and "increased weight" have high scores and the same increasing order of response categories (0 - absence of a symptom, 3 - maximum severity of the symptom), then such response patterns are considered valid under the Rasch system. But realistically, such response patterns are invalid. Therefore, to make these patterns visible as invalid for the Rasch analysis, we reversed the order of responses to the items "increased appetite" and "increased weight" (from 0 - maximum severity of the symptom to 3 – no symptom). In this case, such patterns of responses to these items, for example, as 3-0-2-0, seemed to be valid, and patterns of type 3-2-3-3 were strongly considered as invalid. To determine the validity of response patterns more accurately, we included only the following items in the analysis: "depressive mood," "decreased appetite," "increased appetite," "decreased weight," "increased weight," "concentration difficulties," "self-criticism," "suicidal thoughts," "low interest," and "low energy." We excluded items describing sleep disturbances and psychomotor symptoms from the analysis due to their potential impact on validity evaluations.
The data sample included 275,799 response patterns provided by respondents from the United States from April 2021 to September 2022. Rasch analysis was applied to all the data. Four fit statistics indices were calculated for each response pattern to determine the validity of the responses: unweighted mean square (UMS), standardized unweighted mean square (ZstdUMS), weighted mean square (WMS), and standardized weighted mean square (ZstdWMS). Three ranges of fit statistics values were used to assess validity. Using non-standardized indices, responses that were up to 0.5 were considered excessively predictable, those between 0.5 and 1.5 were considered valid, and responses that were more than 1.5 were regarded as invalid. Standardized indices indicated excessively predictable responses up to -2.0, valid ranges from -2.0 to 2.0, and invalid responses over 2.0. For validity evaluation, two groups of response patterns were selected. Patterns of inadequate responses on appetite and weight items were included in one group, while the other group consisted of responses that had adequate consequences. There were 10,111 presumably invalid patterns in the first group. Among the second group, 5,491 patterns had correct responses related to appetite and weight.
Figure 1 displays the results of using Rasch person fit statistics to identify invalid responses in the first group. As shown in the figure, only the non-standardized unweighted mean square index (UMS) correctly identified invalid responses, while the other indices identified only about half of the invalid patterns. Since all fit statistics were expected to recognize the vast majority of incorrect patterns in the first group, these results were unexpected. In all response data from the first group, high scores were observed for the items "reduced appetite," "increased appetite," "reduced weight," and "increased weight." In each response pattern, at least two answers to items related to appetite and body weight were invalid as they contradicted the other two items pertaining to the same symptoms. When two unexpected responses with maximal categories occurred in a pattern, the total score could shift by six points. In Rasch analysis, all four person fit statistics are considered to evaluate the validity of respondents' responses.
The figure 1 shows the results of using Rasch person fit statistics to recognize invalid responses in the first group.
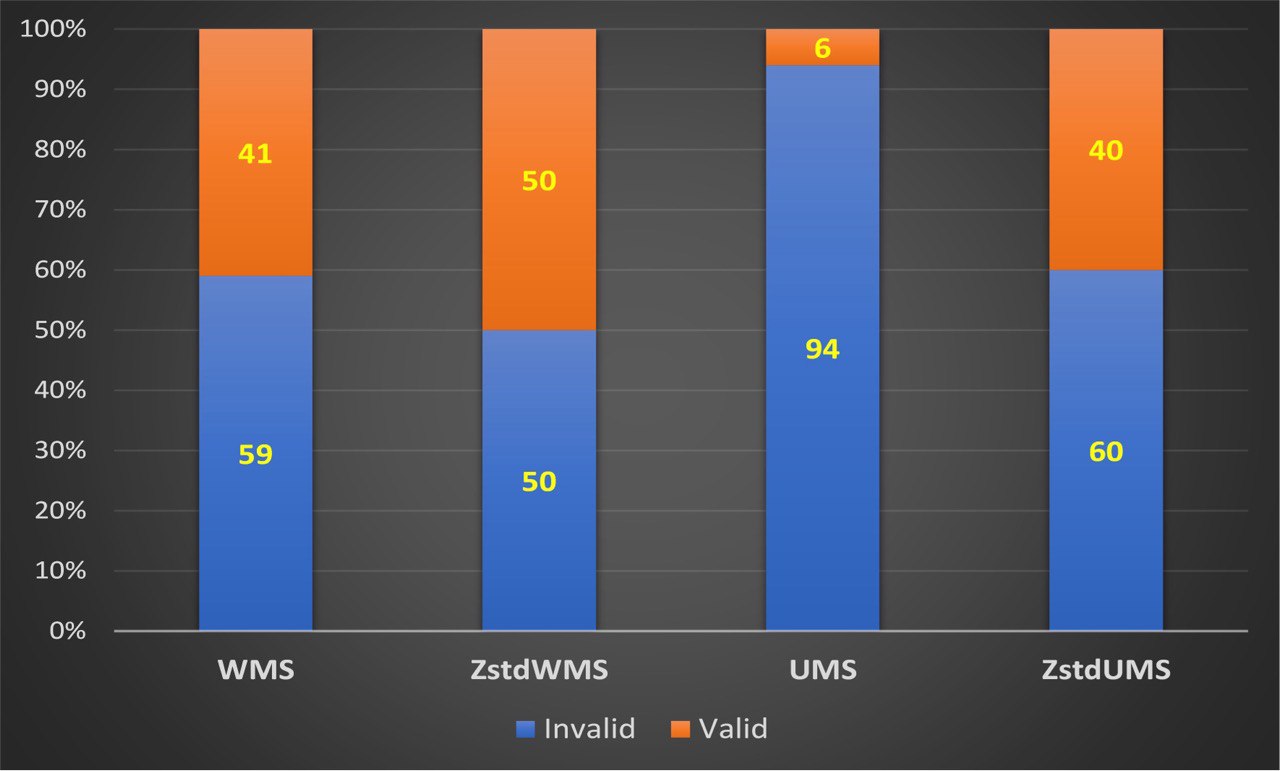
Based on the fact that three out of four fit statistics for the first group revealed approximately 50%-60% of invalid responses, it is possible to conclude that the UMS overestimated the invalidity of respondents' responses if the validity of those responses was unknown in advance. However, this study used completely invalid response patterns as the first group. Therefore, WMS and both standardized person fit statistics tend to consider invalid response patterns to be patterns of good quality.
Next, the validity of the response patterns in the second group was evaluated. In contrast to the first group, the validity of the response patterns in the second group was not known before the analysis. This group only included correct responses to items related to appetite and body weight symptoms, but there is still a possibility that this group could contain invalid patterns caused by incorrect responses to other items. Figure 2 shows the histograms of the distribution of response patterns by quality according to the criteria of person fit statistics for the second group. According to the histogram in the figure, almost all responses from the second group were valid based on the criteria of standardized fit statistics. Non-standardized WMS and UMS criteria evaluated 74%-77% of responses as valid. In contrast to the first group, a small proportion of the response patterns in the second group were considered excessively predictable, which was to be expected. It is impossible to interpret excessively predictable responses corresponding to low fit statistics unambiguously as invalid or valid.
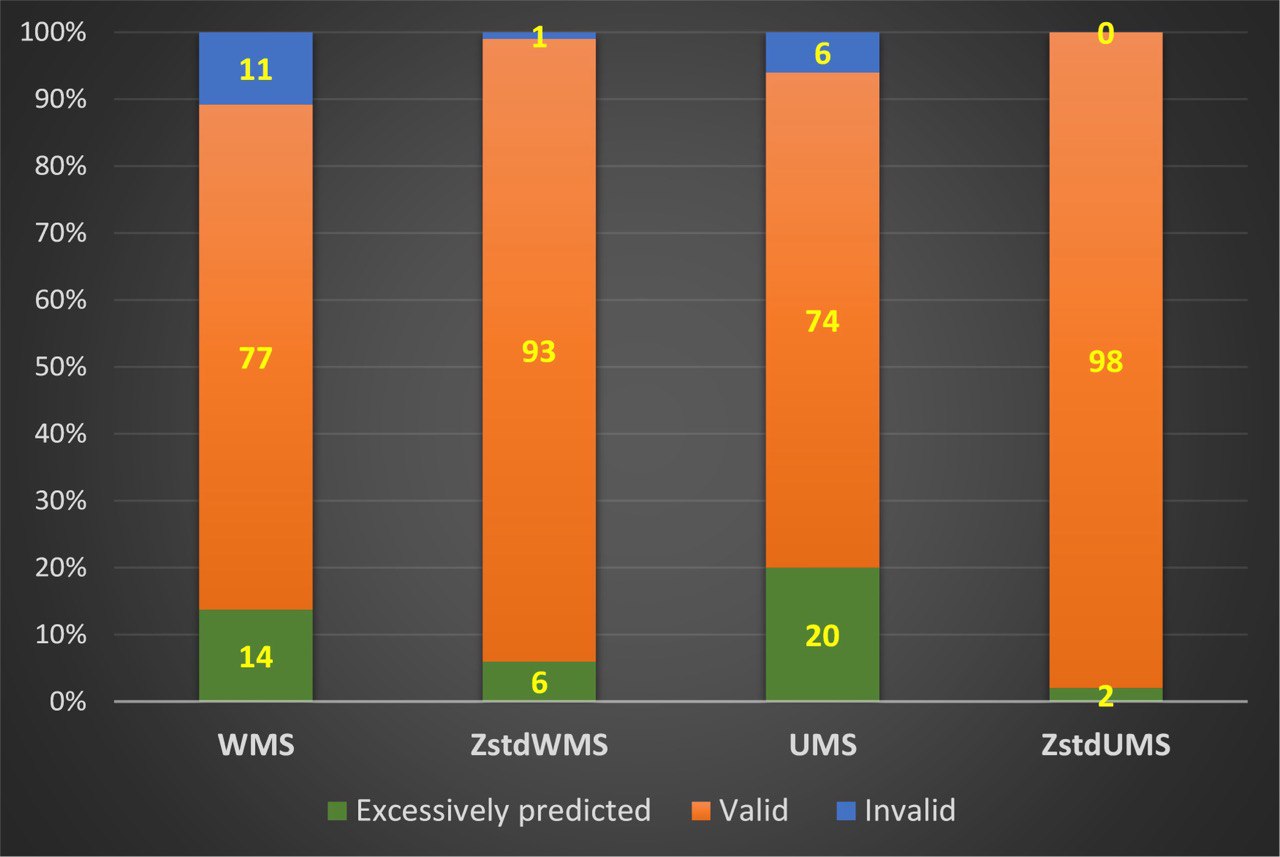
Response patterns with a high degree of predictability have very low variances in item response scores. Such patterns often have the same score for most or all answers. Most likely, response patterns consisting entirely of identical scores are invalid and should be excluded from the study's results. However, it can be difficult to conclude that predictable patterns with low dispersion with non-identical responses are invalid. Since the purpose of the study was not to analyze excessively predictable responses, they were not interpreted negatively. All the invalid responses determined by the ZstdWMS and UMS were also identified by the WMS. Additionally, the WMS fit index revealed 10% more invalid responses than the standardized one and 6% more than the UMS. ZstdUMS criteria indicated that none of the responses in the second group were invalid.
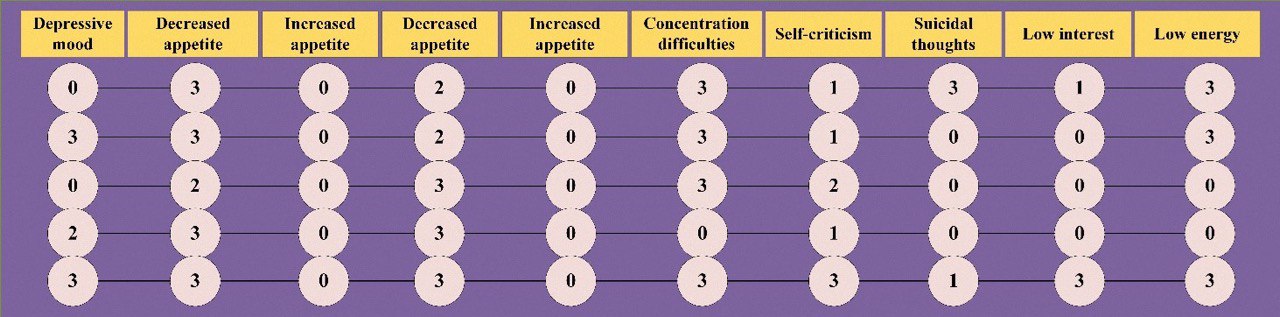
Figure 3 displays examples of response patterns that were deemed invalid based on the WMS criteria but were considered valid according to other fit statistics. It is worth noting that all response patterns in the second group had zero scores for the items "increased appetite" and "increased weight". Generally, Rasch analysis determined that zero scores for these items were correct because they were accompanied by high scores for "reduced appetite" and "reduced weight". Upon analyzing the patterns in the figure, we observe that some responses have high scores while others have zero or low scores. As previously stated, zero scores for items relating to an increase in appetite or weight were recorded in reverse order. Consequently, these null responses were not deemed incorrect during Rasch analysis. However, zero responses to other items were assessed by the Rasch system as actual zero scores. Therefore, the patterns illustrated in Figure 3 are inconsistent and contain contradictory answers. The high severity of certain depression symptoms is accompanied by low severity or the absence of others. As such combinations of symptoms are infrequent in reality, the patterns in Figure 3 should be regarded as invalid. Hence, the WMS index was superior to other fit statistics in detecting invalid patterns in the second group.
Two types of response patterns on the QIDS-SR16 items were evaluated in this study. A first type consisted of invalid patterns with two clearly incorrect responses. Low quality of these patterns was significantly better evaluated using unweighted mean square index (UMS). The UMS criteria identified 94% of invalid patterns, while the remaining fit statistics criteria identified half as many invalid patterns. In the second group, patterns presumably did not have incorrect response sequences, but their validity was largely unknown. It turned out that invalid patterns were present in this group, which were best determined by the weighted mean square criteria. In our opinion, the advantage of unweighted mean square index (UMS) in the first group of patterns is due to its sensitivity to large residuals between expected and observed responses with a relatively low variance of the expected response. Rasch model response prediction with low expected response variance is highly accurate. It means that the modeled response probability is consistent with the observed response in most cases. Consequently, Rasch analysis evaluates response patterns without this correspondence as grossly inconsistent with the expectations of the model. In other words, response patterns exhibiting a sharp discrepancy between the expected and observed responses can be interpreted as outliers. Among the data outliers were all response patterns in the first group with an unexpected discrepancy in responses to items describing changes in appetite and body weight in depression. Due to this, almost all of these response patterns were identified as invalid by unweighted mean square index. Weighted mean square index (WMS) is fit statistic that is weighted by the variance of the expected response. Outliers in single responses will not significantly affect WMS values if the residuals for other responses in such patterns are small and the variance of expected responses is high enough. Since in the Rasch measurement system, the same fit statistics are used both to assess the quality of respondents' responses and questionnaire items, the weighted mean square was developed for the purpose of leveling outliers' impacts on the quality of items first and foremost. Sharply unexpected responses (e.g. outliers) are not so much caused by the quality of items as by respondents' unexpected behavior. As a result, 40% of the patterns with outliers in the first group did not get recognized by the WMS. It is likely that these patterns contained only outliers on two items concerning appetite and body weight and relatively high predictive answers on other items. In spite of the fact that outliers may not have a significant impact on item quality, it is essential to exclude them when we are selecting valid response patterns for further analysis. A total of 3.6% of the data sample showed patterns with outliers in responses on two items about appetite and body weight. But the whole sample may contain substantial number of patterns with outliers in responses to other items. It was not possible to analyze these patterns in this study.
Regarding the second group of response patterns, there were no outliers in responses describing disturbances in appetite and body weight. This led to almost equal identification of invalid patterns by both WMS and UMS criteria, with the weighted index identifying slightly more invalid patterns. This is because it is more sensitive to identifying systematic irregular responses that are not outliers.
The study results suggest that standardized versions of unweighted and weighted fit statistics were ineffective in identifying invalid responses. It was found that the standardized person fit statistics overfitted the validity of both first and second group patterns. We believe that this is due to the peculiarities of transforming unweighted and weighted fit statistics into standardized Z-scores using the Wilson-Hilferty cubic transformation.
The findings propose that the best way to evaluate respondents' response patterns in massive samples of data obtained from mobile psychological assessments is to use Rasch person non-standardized unweighted (UMS) and weighted (WMS) fit statistics. The UMS criteria better identify patterns with sharply mismatched responses. The WMS effectively evaluates patterns that do not have single outliers. The validity of respondents' response patterns can be assessed by using a threshold value of 1.5, which corresponds to the upper limit of valid WMS and UMS values. Any pattern with person fit statistics greater than 1.5 should not be considered suitable for further analysis and formulation of scientifically based conclusions. Due to their overfitting results, standardized fit statistics (ZstdUMS, ZstsWMS) cannot be used to verify respondents' response patterns.
You can download full version of this article here
References
Andrich, D., & Marais, I. (2019). A Course in Rasch Measurement Theory: Measuring in the Educational, Social and Health Sciences. Springer Singapore. https://doi.org/10.1007/978-981-13-7496-8
Areán, P. A., Ly, K. H., & Andersson, G. (2016). Mobile technology for mental health assessment. Dialogues in Clinical Neuroscience, 18(2), 163. https://doi.org/10.31887/DCNS.2016.18.2/PAREAN
Bernstein, I. H., Rush, a J., Trivedi, M. H., Hughes, C. W., Macleod, L., Witte, B. P., Jain, S., Mayes, T. L., & Emslie, G. J. (2010). Psychometric properties of the Quick Inventory of Depressive Symptomatology in adolescents. International Journal of Methods in Psychiatric Research, 19(4), 185–194. https://doi.org/10.1002/mpr.321
Brown, E. S., Murray, M., Carmody, T. J., Kennard, B. D., Hughes, C. W., Khan, D. a, & Rush, a J. (2008). The Quick Inventory of Depressive Symptomatology-Self-report: a psychometric evaluation in patients with asthma and major depressive disorder. Annals of Allergy, Asthma & Immunology : Official Publication of the American College of Allergy, Asthma, & Immunology, 100(5), 433–438. https://doi.org/10.1016/S1081-1206(10)60467-X
Cappelleri, J. C., Jason Lundy, J., & Hays, R. D. (2014). Overview of classical test theory and item response theory for the quantitative assessment of items in developing patient-reported outcomes measures. Clinical Therapeutics, 36(5), 648–662. https://doi.org/10.1016/j.clinthera.2014.04.006
De Champlain, A. F. (2010). A primer on classical test theory and item response theory for assessments in medical education. Medical Education, 44(1), 109–117. https://doi.org/10.1111/j.1365-2923.2009.03425.x
Embretson, S. E., & Reise, S. P. (2013). Item response theory for psychologists. In Item Response Theory for Psychologists. Taylor and Francis. https://doi.org/10.4324/9781410605269
Engelhard, G. (2013). Invariant measurement : using Rasch models in the social, behavioral, and health sciences. Routledge. https://books.google.com/books/about/Invariant_Measurement.html?hl=ru&id=ZRkK7RFsIOkC
Green, K., & Frantom, C. (2002). Survey development and validation with the Rasch model. International Conference on Questionnaire Development, Evaluation, and Testing, 1–30.
Harari, G. M., Lane, N. D., Wang, R., Crosier, B. S., Campbell, A. T., & Gosling, S. D. (2016). Using Smartphones to Collect Behavioral Data in Psychological Science: Opportunities, Practical Considerations, and Challenges. Perspectives on Psychological Science, 11(6), 838–854. https://doi.org/10.1177/1745691616650285
Mari, L., Maul, A., Torres Irribarra, D., & Wilson, M. (2017). Quantities, Quantification, and the Necessary and Sufficient Conditions for Measurement. Measurement: Journal of the International Measurement Confederation, 100, 115–121. https://doi.org/10.1016/j.measurement.2016.12.050
Mari, L., Wilson, M., & Maul, A. (2021). Measurement across the Sciences. https://doi.org/10.1007/978-3-030-65558-7
McClimans, L., Browne, J., & Cano, S. (2017). Clinical outcome measurement: Models, theory, psychometrics and practice. Studies in History and Philosophy of Science Part A, 65–66, 67–73. https://doi.org/10.1016/j.shpsa.2017.06.004
Mohamad, M. M., Sulaiman, N. L., Sern, L. C., & Salleh, K. M. (2015). Measuring the Validity and Reliability of Research Instruments. Procedia - Social and Behavioral Sciences, 204, 164–171. https://doi.org/10.1016/j.sbspro.2015.08.129
Rüegger, D., Stieger, M., Nißen, M., Allemand, M., Fleisch, E., & Kowatsch, T. (2020). How Are Personality States Associated with Smartphone Data? European Journal of Personality, 34(5), 687–713. https://doi.org/10.1002/PER.2309
Rush, a J., Trivedi, M. H., Ibrahim, H. M., Carmody, T. J., Arnow, B., Klein, D. N., Markowitz, J. C., Ninan, P. T., Kornstein, S., Manber, R., Thase, M. E., Kocsis, J. H., & Keller, M. B. (2003). The 16-Item Quick Inventory of Depressive Symptomatology (QIDS), clinician rating (QIDS-C), and self-report (QIDS-SR): a psychometric evaluation in patients with chronic major depression. Depression, 54(5), 573–583. https://doi.org/10.1016/S0006-3223(03)01866-8
Rush, A. J., Trivedi, M. H., Ibrahim, H. M., Carmody, T. J., Arnow, B., Klein, D. N., Markowitz, J. C., Ninan, P. T., Kornstein, S., Manber, R., Thase, M. E., Kocsis, J. H., & Keller, M. B. (2003). The 16-Item Quick Inventory of Depressive Symptomatology (QIDS), Clinician Rating (QIDS-C), and Self-Report (QIDS-SR): A Psychometric Evaluation in Patients with Chronic Major Depression. Biol Psychiatry, 54, 573–583. https://doi.org/10.1016/S0006-3223(03)01866-8
Trivedi, M. H., Rush, A. J., Ibrahim, H. M., Carmody, T. J., Biggs, M. M., Suppes, T., Crismon, M. L., Shorles-Wilson, K., Toprac, M. G., Dennehy, E. B., Witte, B., & Kashner, T. M. (2004). The Inventory of Depressive Symptomatology, clinician rating (IDS-C) and self-report (IDS-SR), and the Quick Inventory Depressive Symptomatology, clinician rating (QIDS-C) and self-report (QIDS-SR) in public sector patients with mood disorders: A psychome. Psychological Medicine, 34(1), 73–82. https://doi.org/10.1017/S0033291703001107
Wang, K., Varma, D. S., & Prosperi, M. (2018). A systematic review of the effectiveness of mobile apps for monitoring and management of mental health symptoms or disorders. Journal of Psychiatric Research, 107, 73–78. https://doi.org/10.1016/J.JPSYCHIRES.2018.10.006
Wright, B. D. L. J. M. (1994). Reasonable mean-square fit values. Rasch Measurement Transaction, 8(3), 370.
Wright, B. D., & Masters, G. N. (1990). Computation of OUTFIT and INFIT statistics. Rasch Measurement Transactions, 3(4), 84–85.


.jpg)


